
 Japan
Japan UnitedStates
 China
China Hong Kong
 Mongolia
 Russia
 Thailand
 Vietnam
 Laos
Laos Cambodia
 Myanmar
 Indonesia
 Philippines
 Singapore
 Malaysia
 India
India Bangladesh
 Pakistan
 Sri Lanka
 Mexico
 Brazil
 Peru
Peru Colombia
 Chile
Chile Argentina
 DubaiAbuDhabi
 Turkey
 South Africa
 Nigeria
 Egypt
Egypt Morocco
 Kenya
KenyaPeru
2 Chapter Investment Environment
-
-
GDP and GDP growth rate
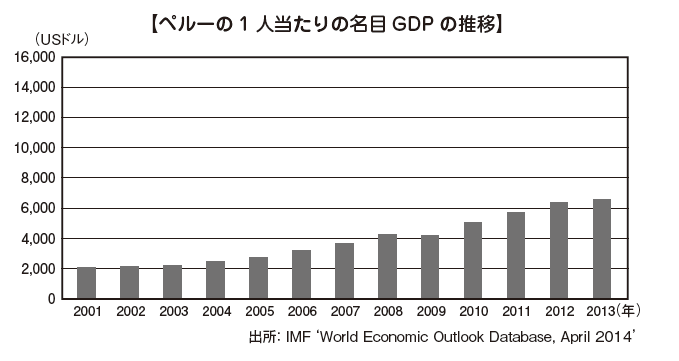
■ GDP and GDP growth rateAlthough it has achieved high growth of several percent since around 2003, it fell in 2009 due to the influence of the global financial crisis but in the following year it recovered at V time.Peru is a country rich in subsurface resources, continuing economic growth with the resource export as the driving force, and furthermore, it seems that Peru is entering the growth cycle that domestic demand grows as the middle class expands with the strong economy It is.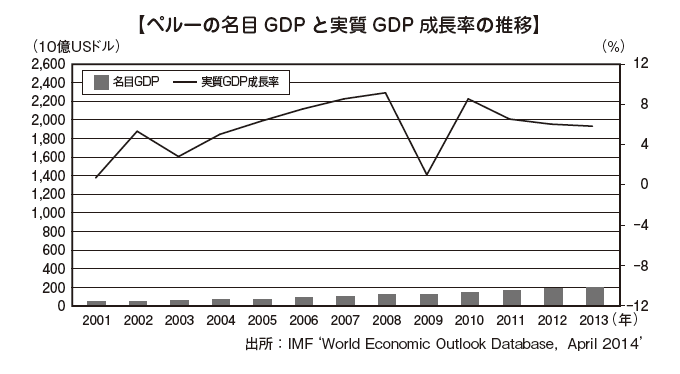
-
Finance and external debt
■ Finance and external debtThe South American economy has imagery such as fiscal deficit, hyperinflation and excessive external debt. Many countries were in such a situation from the 1980s to the 1990s, but due to the subsequent economic liberalization policy and appropriate fiscal management, many countries acquired a stable economic base in the 21st century It is the present condition.Among them, Peru is said to be an honor student in the South American economy, the financial condition is sound, supported by strong resource export, the reserve balance is high, the outstanding debt ratio outstanding is kept low, overall it is good. In response to these indicators, the rating of sovereign bonds by major credit rating agencies in the United States has improved compared with the 1990s, except for Argentina, it is eligible for investment.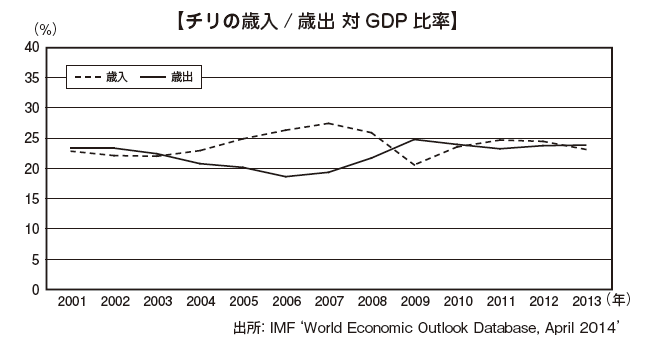
[Sovereign bond rating]
Peru Moody's A 3
S & P BBB +
Fitch BBB +
-
Trade
■ TradePeru is active in liberalizing trade, and has increased the amount of trade several times over the past decade. Both exports and imports were retreated in 2009 due to the influence of the global financial crisis, but it has recovered greatly the following year.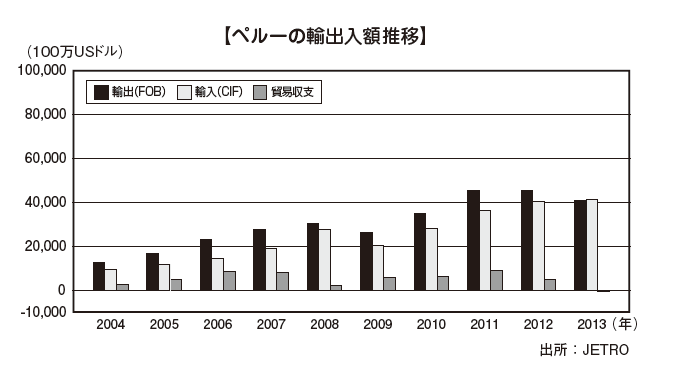 [Export by item]In Peru, the proportion of mineral products etc in export items is large, 50.0%. Metal ore such as copper and zinc accounts for more than 50% of the breakdown.
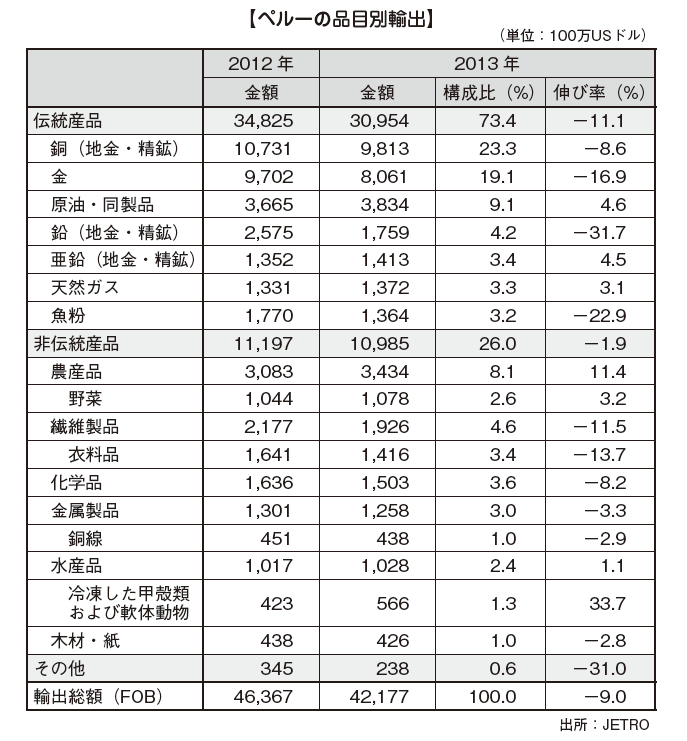 [Exports by country / region]
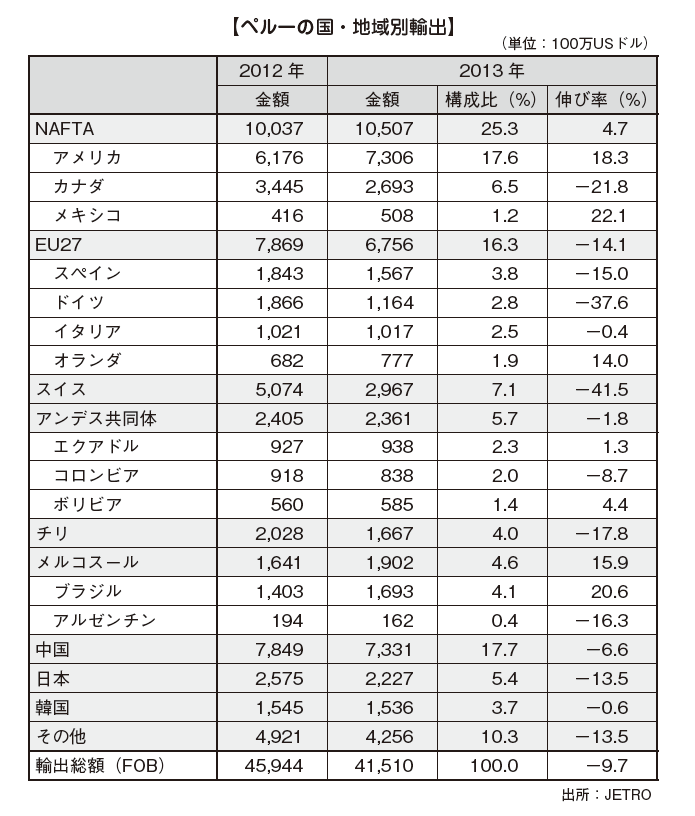 [Imports by country / region]
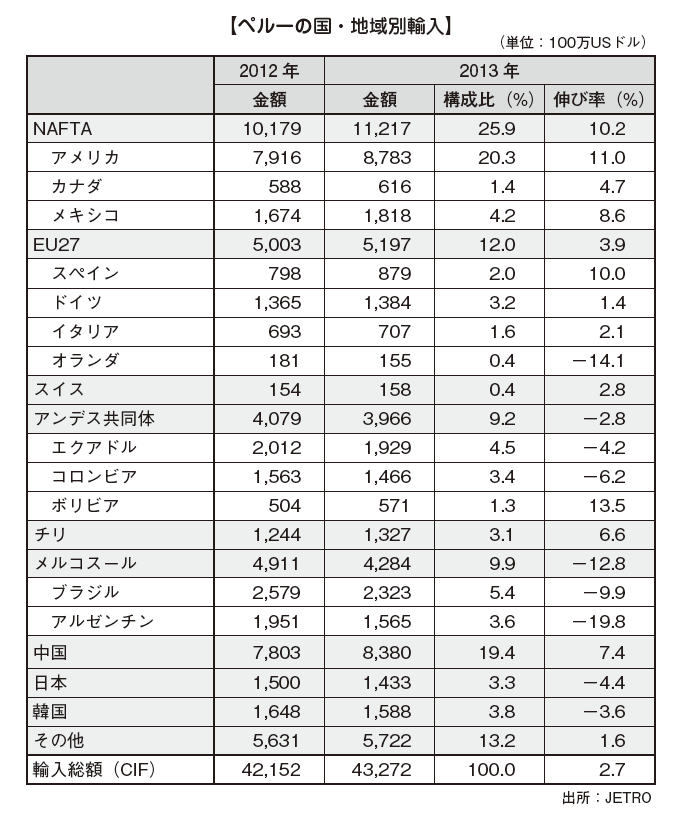
-
Industry trends
■ Industry Trends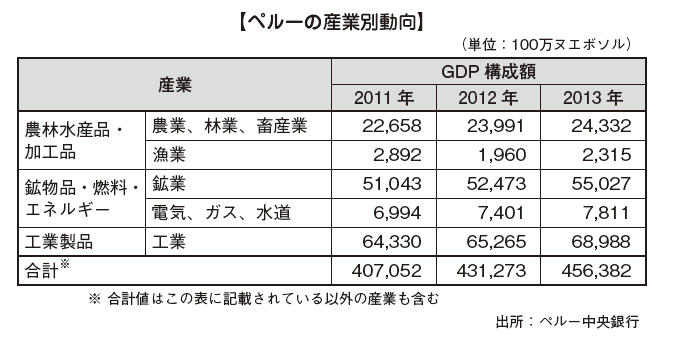 [Mining]In Peru the ratio of copper and zinc production to GDP is not particularly large. It is a "monoculture" type economic structure that depends on the export of resources, but due to resource revenues generating middle classes and expansion of domestic demand, industries such as manufacturing industry for domestic development are developing. In the future, how to develop industries other than mining is a key point.[Manufacturing industry]There are about 15% of Peru's manufacturing industry, but mainly light industry such as textile products and chemical products.
 -
Direct finance
■ Direct financing (stock) market · Exchange[Stock exchanges]Peru has established a national representative stock exchange in the capital city where government functions are located.Peru's Lima Stock Exchange (BVL) was relatively new as founded in 1971, and 277 companies are listed on the end of 2012. Although the market size is less than Chilean SSE and Colombian BVC in the same resource country, with a transaction price of US $ 6.1 billion and market capitalization of US $ 102.6 billion, it is nearly three times larger than Argentina BCBA.Also, there is the BVL's Lima Comprehensive Stock Price Index (IGBVL) as a representative stock price index, and although these indices were generally steady until September 2014, they have declined since September .[Currency]In the currency Peru adopts a currency called "Nuevo Sol". -
Foreign direct investment
■ Foreign Direct Investment (FDI) Amount[Amount of Foreign Investment Accepted by Industry]With regard to FDI, it is said that you can see not only the amount but also the industry type of the investee, how much it affects the domestic economy such as employment. Most of the FDI to Peru is directed towards resource development, and it has become a structure that does not lead to much employment creation etc.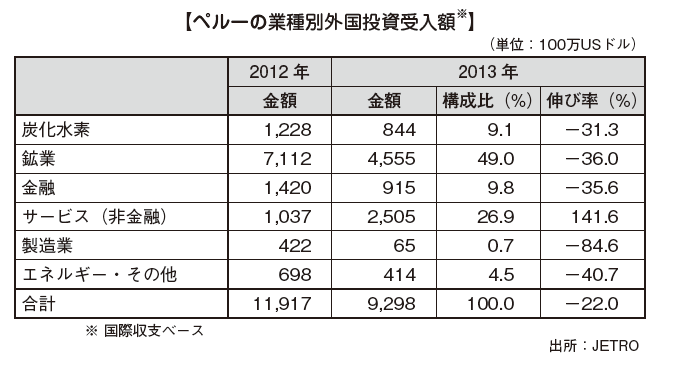 [Amount of Foreign Investment Accepted by Country / Region]Looking at FDI by investment country / region, you can see that the countries in which investment is implemented are widely dispersed all over the world. In addition, Peru and Japan have bilateral economic partnership agreements (EPAs).
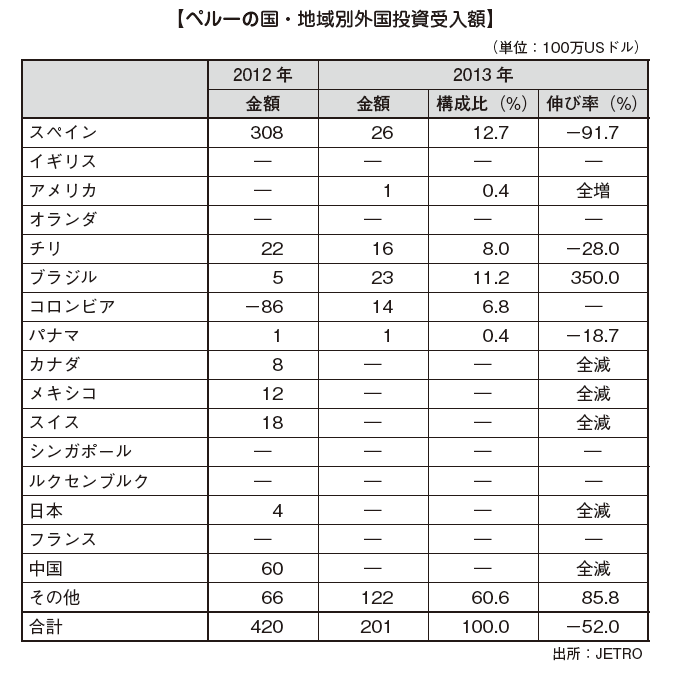
-
infrastructure
■ Infrastructure
According to the Global Competitiveness Report 2013-2014, which is conducted by the World Economic Forum to investigate the global competitiveness of infrastructure etc., Peru is 61st among 148 countries surveyed.
road
The Pan American Highway running vertically through the Americas passes through all four countries. Motorization progresses in South America in general, cars in Argentina and others are almost exclusive transportation agencies. Road maintenance is done extensively under domestic and international cooperation.
Harbor
The Arica Port in the northern part of Chile is a unique harbor in which some administrative control rights are transferred to Peru and a large proportion of Bolivia's cargo in neighboring countries accounts for the total handling volume.
airport
Hello to Chief of Peru
Beth International Airport is a major airport, El Dorado International Airport is Avianca Airways, and Arturo Merino Benitez International Airport is Run Air's Hub Airport.
[Transport infrastructure]
The infrastructure level in South American countries is not so high, especially for transportation infrastructure, there is the impression that it is considerably lagging behind the countries of other regions surveyed in the international competitiveness report. In order to maintain international competitiveness among companies in Latin America and the United States, therefore, we are making efforts to enrich traffic infrastructure that makes logistics more efficient.
【Distribution cost vs. GDP ratio】 The Peruvian logistics cost versus GDP ratio is 32.0%.
In South American countries, high logistics costs involved in transportation and distribution have been pointed out for a long time. Although there are also influences of the Andean mountain range that goes through South American countries, the main reason is that the infrastructure development is insufficient. As a result, goods and products do not flow well, and the inventory owned by companies also increases. Let's check the inventory level of each country compared with the United States.
[Stock level (relative to the United States)] This is inventory level of Peru's ratio to the United States at 4.19 times.
Here too we can see that each one is quite high level, with Peru's 4.19 times the ratio to the USA. However, these are numerical values related to raw materials, and products have been in inventory levels of 1.5 to 2 times.
-
Market Overview
Market OverviewThe strength of the Peru market is that it differs from other South American neighboring countries such as high GDP growth rate, inexpensive labor force, good security and so on.On the other hand, domestic distribution is underdeveloped, the difficulty of securing excellent human resources due to low educational standards, and the enlargement of human resources development costs are concerns of investment.As a point to keep in mind, it is difficult for foreign companies to enter new markets, as domestic distribution systems are underdeveloped.As an overall characteristic, Korean and Chinese companies are already looking at these South American countries as new investment destinations, and in recent years investment amount has been increasing year by year. I will check the concrete advancement situation in the next section.Advance trends of Japanese companiesLooking at the trends of Japanese enterprises' expansion in Peru, at the end of 2013, Peru 35 companies (these figures are investment by Japanese companies and corporations established by locally-living residents are not included) There was no direct investment from Japan. -
Present state of business environment 2019
Peru Investment Environment.
Present state of business environment 2019.
Between 2002 and 2013 experienced one of the fastest growth in Latin America, with an average growth rate of 6.1% annually. But between 2014 and 2017 the GDP growth slowed to an average of 3.0 % due to the decline in international commodity prices, this includes copper, this led to lower investment, less fiscal income and weak consumption. Since 2018 GDP has been expected to increase due to a recovery in domestic demand. Peru's economy experience a good year in 2018 the country grew at a 4% rate, the inflation rate is 1.3% by 2019 and the unemployment rate 6.8%.
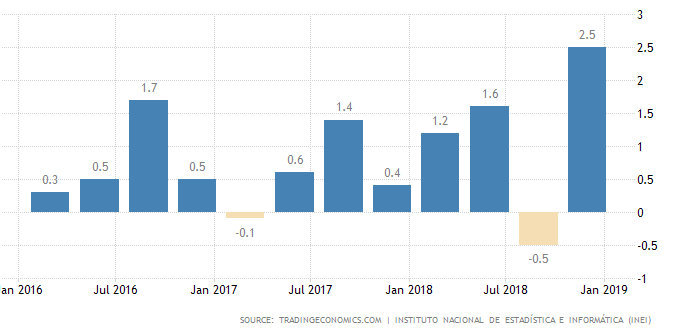
GDP and growth rate
The GDP value of Peru represents 0.34% of the world economy. In 2018, Peru's growth was up to 4.0%, above the 2.5% of 2017. GDP Growth Rate in Peru averaged 1.29 percent from 2002 until 2018.
Peru's Growth Rate.
Finance and external debt.
The External Debt in Peru increased to 78263 USD Million in the fourth quarter of 2018 from 75267 USD Million in the third quarter of 2018.

Market Overview.
It is expected that for 2020 GDP growth rate will be 2.3%, Inflation rate 2.4%, and interest rate in 4% and the unemployment rate 7.2% Now in 2019 The GDP is 2.50%, Inflation rate 2.25%, interest rate, 2.75% and unemployment rate in 7.60%. The Stock Market is expected to have 20069 points by 2020.
Stock market exchange.
The IGBVL (Bolsa de Valores de Lima General Sector Index) is a major stock market index which tracks the performance of the largest and most actively traded stocks listed on the Lima Exchange in Peru. Currently Peru´s Stock Market has 21279.33 Points and its currency is 3.29
Stock level relative to the United States.
Currently Peru´s Stock Market has 21279.33 Points and its currency is 3.29, in comparison with USA´s Stock Market with 26157.16 points and 96.91 of its currency.
Trade.
About Peru's trade balance the surplus narrowed to 326 million USD in February 2019 from 552 million USD in February 2018. Imports increased 2.8 % mainly due to purchases of raw materials and intermediate goods with 2.9 %, capital goods 4.9 % and non-durable consumer goods 9.7%. And exports decreased 3.8% due to lower sales of mining products -12%, chemicals -12.4 %, sidero-metallurgical and jewelry -28.8% and agricultural products -2.5%. Only exports of crude oil and natural gas rose 25.8 % and those of fisheries products increased 96.7%.
Exports
According to the National Institute of Statistics and Informatics in January 2019, the main countries and items for exports were as follows:
Exports January 2019
Country
Product
January 2018 (Millions of USD)
January 2019 (Millions of USD)
China
Copper
718.3
995
Fish flour
0.6
72.1
Zinc
36.6
54.3
Lead
62.1
51.5
Iron
39.9
50.6
Natural Gas
26.7
USA
Grapes
100.8
129.7
Other minerals
15.6
52.5
Cranberries
17.7
46.6
Petrol without tetraethyl lead for automobile engines
39.9
34.4
Mangos and mangosteens
24.7
33.1
Copper
0.1
23.1
South Korea
Copper
128.6
58.7
Natural Gas
29.6
54.8
Zinc
49.1
41.9
Squid, cuttlefish and cuttlefish
14.2
27.5
Netherlands
Natural Gas
38.7
Grapes
20.1
25.6
Mangos and mangosteens
30.3
25.1
Canada
Gold
15.7
49.3
Zinc
32.7
Spain
Copper
52.1
38.9
Zinc
17.6
17.2
Squid, cuttlefish and cuttlefish
9.4
12.1
Imports
According to the National Institute of Statistics and Informatics in January 2019, the main countries and items for imports were as follows:
Imports January 2019
Country
Product
January 2018 (Millions of USD)
January 2019 (Millions of USD)
China
Mobile phones and those of other wireless networks
57.7
65.8
Machines for data processing weighing ≤ 10 kg
20.3
27.5
Televisions
17.3
20.9
Digital telecommunication devices
17.9
19.7
Other polyethylene
9.8
12.9
Automobiles
9.9
12.3
Shoes
10.1
11.4
USA
Diesel 2
98.5
97.8
Diesel B5, with a sulfur content ≤ 50 ppm
49
63.1
Petrol without tetraethyl lead for automobile engines
60
59.7
Hard yellow corn
62.9
48.9
Crude oil
0
44.9
Machines whose superstructure can rotate 360 °
5.4
16
Brazil
Papers weighing ≥ 40 g / m2 but ≤ 150 g / m2 in sheets
4.9
0.3
Automobiles
7.1
8
Intermediate products of iron or steel
1.8
5.4
Diesel vehicles for transport> 16 people
2.9
5.3
Mexico
Televisions
19.6
15.2
Digital processing units, excludes items 84714100 and 84714900
7.6
7.1
Copper
6.8
Shampoo
5.5
6.2
Ecuador
Crude oil
106.7
92.6
Other particle boards and similar wood boards
2
3.3
Copper
1.1
3.1
Preparations used for feeding animals
2.5
2.8
Argentina
Raw soybean oil
24.4
31.9
Trucks
6.5
12.4
Shrimp tails with shell
10.1
8.6
Industry trends.
The manufacturing sector participates with 13% in the national GDP, it is the second largest sector in the economy of the country. The main industries in the manufacturing sector are food and beverages, chemicals, common metals, non-metallic mineral products, textiles and clothing.
Mining.
The metal extraction stagnated in 2018 due to temporary supply problems in copper mines and depletion of some gold units, but in 2019 metal prices cover production costs and financing costs are still relatively low. In copper mines the investment is mainly concentrated in three projects: Quellaveco (with a total investment of more than USD 5 billion), Mina Justa (USD 1.6 billion), and the extension of Toromocho (USD 1.3 thousand) millions
Manufacturing.
In January 2019, manufacturing industrial production decreased 5.6%, mainly due to a lower performance in the industrial fishing and refining of ferrous metals. Non-primary manufacturing recorded a production growth of 3.5% in January 2019. Mainly the increase in the production of intermediate goods by 4.8%, good consumption 2.8% and services related to industry 15.0%.
Foreign Direct Investment.
Peru is the fourth recipient of FDI in Latin America after Brazil, Colombia and Chile and according to the central bank of Peru the direct foreign investment in 2016 was 6,863 million dollars, the projection for 2019 is 6745 million dollars.
By industry.
According to the Central Bank of Peru the Foreign direct Investment in 2018 was the following:
Sector
Amount (Millions of Dollars)
Mining
5,711.4
Communications
5,324.2
Finance
4,695.2
Energy
3,446.1
Industry
3,216.4
Commerce
851.4
Oil
679.7
Services
676.7
Transport
520.9
Construction
396.5
Fishing
163.0
Turism
83.4
Agriculture
82.9
Housing
81.6
Forestry
1.2
Total
25,930.6
By country.
The countries that invested the most in 2018 according to the central bank of Peru are the following:
Country
Amount (Millions of USD)
Spain
4,567.5
United Kingdom
4,364.3
Chile
3,402.2
USA
3,193.8
Netherlands
1,575.7
Infrastructure
The World Economic Forum´s report "The global competitiveness report 2017-2018" puts Peru into the following rankings in their comprehensive evaluation of infrastructure.
Infrastructure
86
Quality of overall infrastructure
111
Quality of roads
108
Quality of railroad infrastructure
87
Quality of port infrastructure
83
Quality of air transport infrastructure
85
Available airline seat kilometers(millions/week)
42
Quality of electricity supply
62
Mobile-cellular telephone subscriptions
69
Fixed-telephone lines
83
Road
The country has several types of roads and highways, such as international routes, national routes, departmental or regional routes, and local or rural routes. Highways from north to south are designated with odd numbers and numbered from smallest to largest from west to the east. And the roads from east to west are designated with even numbers and numbered from smallest to largest from the north to the south.
Harbor.
There are 33 ports and harbors the most popular are in Callao, Iquitos, Paita, Ilo, Matarani, Salaverry.
Airport.
Total airports in Peru are 234 airports, 3 are international airports, 24 domestic airports with scheduled services, 60 domestic airports without scheduled services, and 5 military airports, making a total of 90 main airports, of which 27 feature scheduled services.
Transportation
Peru has focused in the development of its infrastructure looking to increase its competitiveness for the transport of materials and goods to Asia-Pacific economic region. Said development efforts includes modernization of the railways, ports and airports. Peru is looking to become a commercial bridge between South America, Asia and the United States, the useful tools in this scenario are the Free Trade Agreement (FTA) and Trans-Pacific Partnership (TPP), this will provide an advantage when using any of the 22 logistics corridors with multimodal interconnection.
Distribution costs.
A top priority in Peru is to improve transportation networks for this, the country will initiate a project called "Observatory of Logistics" that will begin in the second semester of 2019, to cooperate with companies that import and export products in Peru. This will make it possible to make transparent the rates of commerce provided to foreign trade, ports, warehouses, transporters, couriers and customs agents, among others.
References:
Peru GDP growth rate, Trading Economics, 2019
https://tradingeconomics.com/peru/gdp-growth
GDP in Peru, Focus Economics,https://www.focus-economics.com/country-indicator/peru/gdp
The World Economic Forum´s report "The global competitiveness report 2017-2018"
Inversión Extranjera, Proinversión 2019.
https://www.proinversion.gob.pe/modulos/jer/PlantillaPopUp.aspx?ARE=0&PFL=0&JER=5975
Instituto Nacional de Estadística e Informática, Evolución de las exportaciones e importaciones, January 2019.
https://www.inei.gob.pe/biblioteca-virtual/boletines/exportaciones-e-importaciones/2/
Estudios Económicos, Estadística Manufactura, Ministerio de la Producción, 2019
http://ogeiee.produce.gob.pe/index.php/shortcode/estadistica-oee/estadisticas-manufactura
Peru, Situación del sector minero, Vanessa Belapatiño, Yalina Crispin, Francisco Grippa. Febrero 2019 https://www.bbvaresearch.com/publicaciones/peru-situacion-del-sector-minero-febrero-2019/
Transport Infrastructure, ProInversión, Private Investment Promotion Agency Peru. 2019
https://www.investinperu.pe/modulos/JER/PlantillaStandard.aspx?are=1&prf=0&jer=5941&sec=17
Trading Economics, Peru Balance of Trade, 2019
https://tradingeconomics.com/peru/balance-of-trade
Trading Economics, Peru General Index S&P/BVL, 2019
https://tradingeconomics.com/peru/stock-market
World Bank Overview, Peru 2019,
https://www.worldbank.org/en/country/peru/overview
-